The US midterm elections in 2026, scheduled for November 3, serve as a crucial milestone for America’s political landscape, determining which party will control Congress during the latter half of Donald Trump’s presidency. These elections will influence legislative priorities, shape policy directions, and set the tone for the 2028 presidential race.
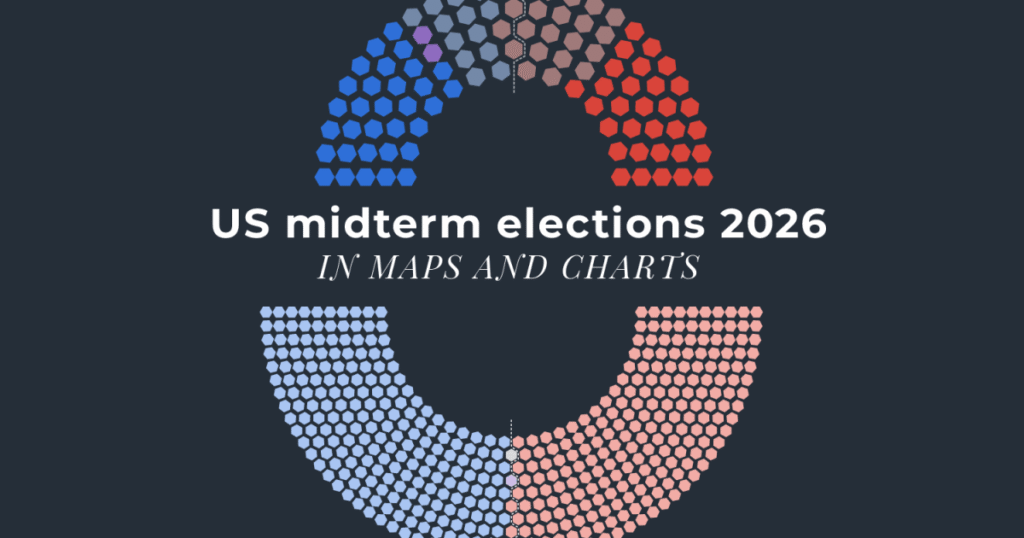
Understanding these elections through maps and charts offers an insightful perspective into the dynamics at play. Typically, midterm elections encompass a nationwide contest for all 435 seats in the House of Representatives and about one-third of the 100 Senate seats. Also, numerous governorships and state legislatures are on the ballot.
Geographic maps visually represent the distribution of party control across states and districts. These maps highlight battleground areas where races are tight, as well as strongholds of both the Republican and Democratic parties. Red and blue color coding provides an intuitive look at which party currently holds or is predicted to win certain areas based on polling data and historical trends.
Charts complement these visuals by tracking changes in party seat counts over time, voter turnout statistics, and demographic shifts that affect voting patterns. For example, bar graphs may illustrate the number of seats won by Republicans versus Democrats in each state, while line charts track polls leading up to Election Day.
The 2026 midterms are particularly significant because they will reflect public opinion on the Trump administration’s agenda and governance. Polling maps may show how approval ratings vary regionally, influencing voter enthusiasm and the likelihood of competitive races.
Another important aspect is the impact of redistricting, which occurs every ten years after the census. Redrawn districts can alter the balance of power by reshaping which voters are grouped together, potentially favoring one party.
Maps also depict demographic changes, such as increasing urbanization or migration trends, which often correlate with shifts in political leanings. For example, suburban areas have previously become key battlegrounds as their voter base diversifies.
Additionally, charts offer a breakdown of voter demographics, such as age, race, and education level, illuminating which groups are pivotal for each party. Midterm elections typically see lower turnout than presidential years, so mobilizing these demographic groups is critical.
The interplay between local issues and national politics makes the 2026 midterms a complex mosaic that maps and charts help decode. From economic concerns to social policies, voters’ choices will be influenced by a broad array of factors that manifest differently across states and communities.
Analyzing historical midterm data reveals patterns of the party in the White House often losing seats in Congress during these elections, a phenomenon known as the ‘midterm penalty.’ However, unique contemporary factors could alter this trend.
In conclusion, the US midterm elections of 2026 are a pivotal event with widespread implications. Maps and charts serve as vital tools for understanding the electoral landscape, illuminating the many variables at play, and offering a clear visual representation of the evolving political scenario in America.